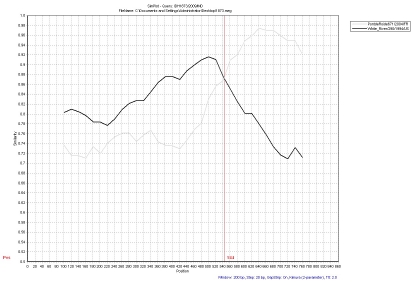
Figure 3.
Nucleotide identity plot between the query sequence (IDH1873) and two reference NoV strains (Whiteriver/290 and PontdeRoide671) using SimPlot program. A window size of 200 nucleotides with an increment of 20 was used. The vertical axis indicates the nucleotide similarity between the query sequence and the other reference strains expressed as a percentage. The horizontal axis indicates nucleotide positions.

