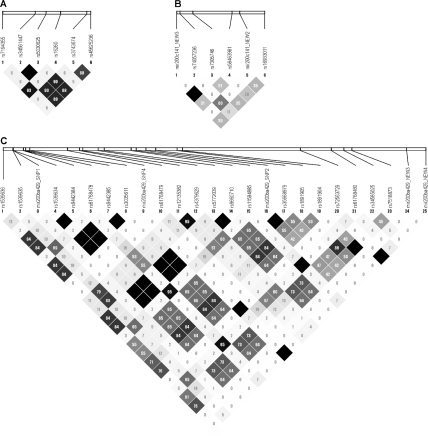
Figure 1.
The LD plots for the E-cadherin promoter (1A), miR-200c-141 cluster (1B), and miR-200b-a-429 cluster (1C). The number in each diamond represents the r2 between any two corresponding SNPs. The r2 between any two SNPs in a candidate region is also displayed by the shades of grey in each diamond with white and black representing no LD (r2 = 0) and prefect LD (r2 = 1), respectively.

