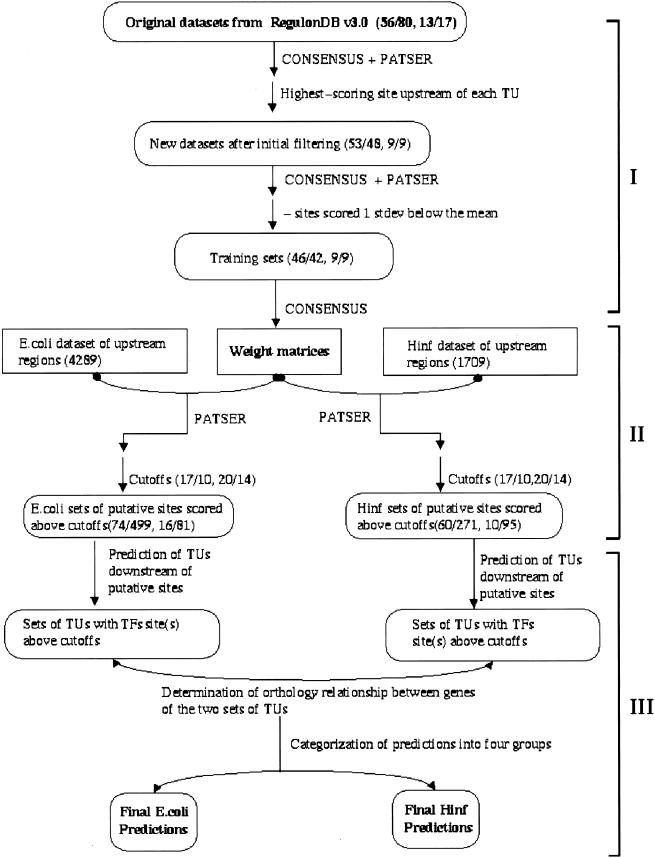
Figure 1.
Flowchart depicting our overall strategy for predicting additional members of CRP and FNR regulons. The approach is divided into three stages. In the first stage (I), raw data sets from RegulonDB are filtered for strong binding sites, and weight matrices based on these strong sites are generated. Two pairs of numbers are shown in this part of the chart; the first pair is CRP data and the second pair FNR data. Within each number pair, the first number is the number of TUs regulated by a particular transcription factor, and the second number is the number of transcription factor binding sites. In the second stage (II), regulatory region (−400 to +50 bp) of each ORF in both genomes (4289 in E. coli and 1709 in H. influenzae) are searched by PATSER for potential transcription factor binding sites. Cutoff scores for strong (17 for CRP and 20 for FNR) and weak (10 for CRP and 14 for FNR) binding sites are chosen. Only predicted sites scored above weak site cutoffs are used for further analyses. Numbers of predicted CRP- and FNR-binding sites scored above cutoffs are shown for both genomes. The first pair of numbers represent CRP sites and the second FNR sites. In stage three (III), transcription units after predicted binding sites are predicted, and the orthology relationship between genes in E. coli and H. influenzae transcription units are determined. Finally, site scores and orthology information are used together to categorize our predictions. TU, transcription unit; TF, transcription factor.

