
Figure 2.
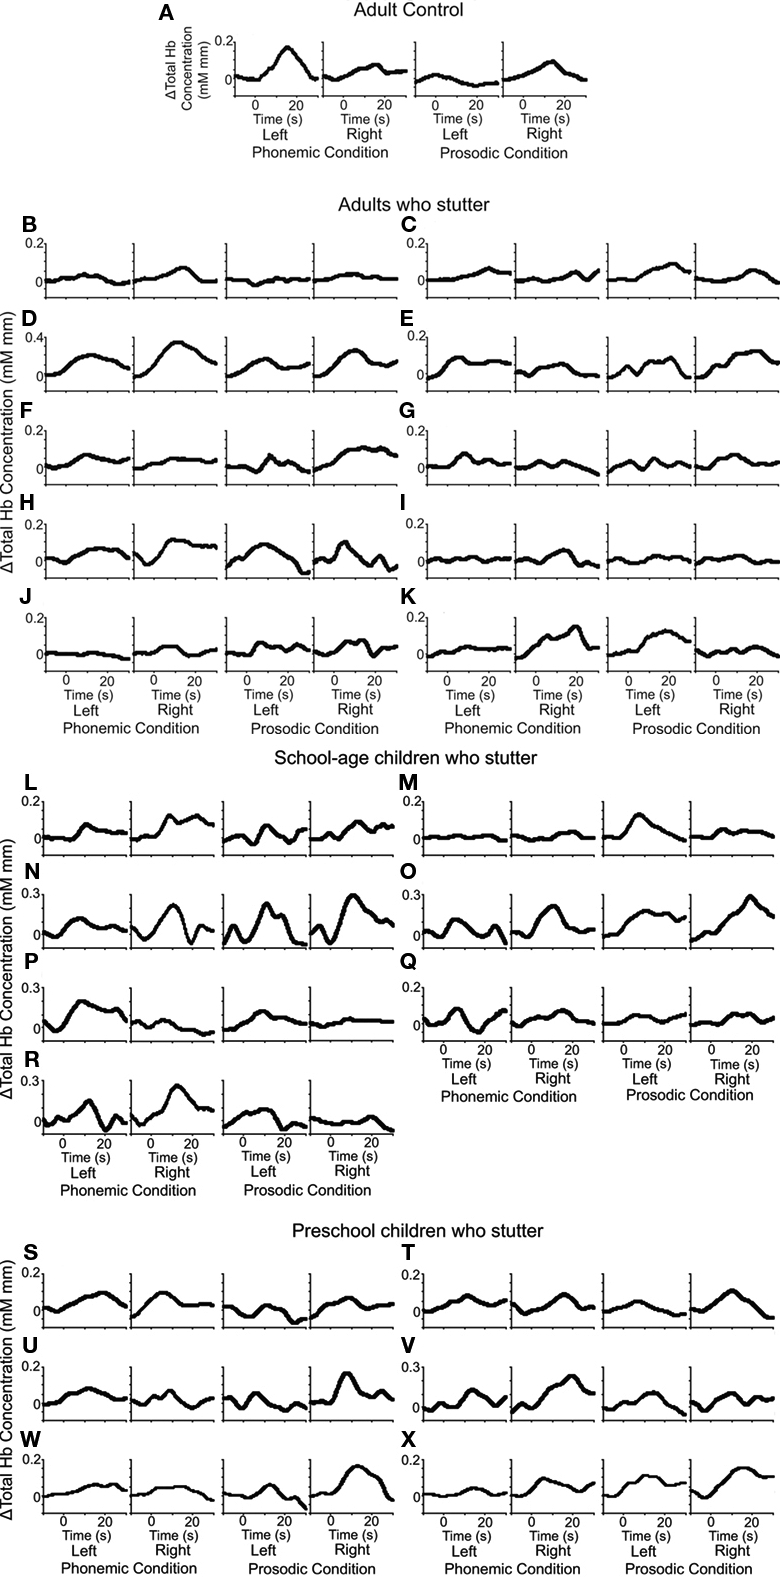
Hemoglobin responses evoked by the phonemic and prosodic contrasts. Time courses of NIRS responses of total Hb in the temporal areas (left and right) are shown for individual subjects: the responses of a non-stuttering adult (adult control; data adopted from Furuya and Mori, 2003) (A), and the responses of people who stutter (PWS): adults (B–K), school-age children (L–R), and preschool children (S–X). The abscissas indicate time and the ordinates indicate total Hb concentration changes. The vertical lines at 0 and 20 s show the beginning and the end of the test blocks, respectively. In (A), the larger responses are seen in the left side under the phonemic condition and in the right side under the prosodic condition. Few of the stuttering subjects showed this normal response pattern under either condition.