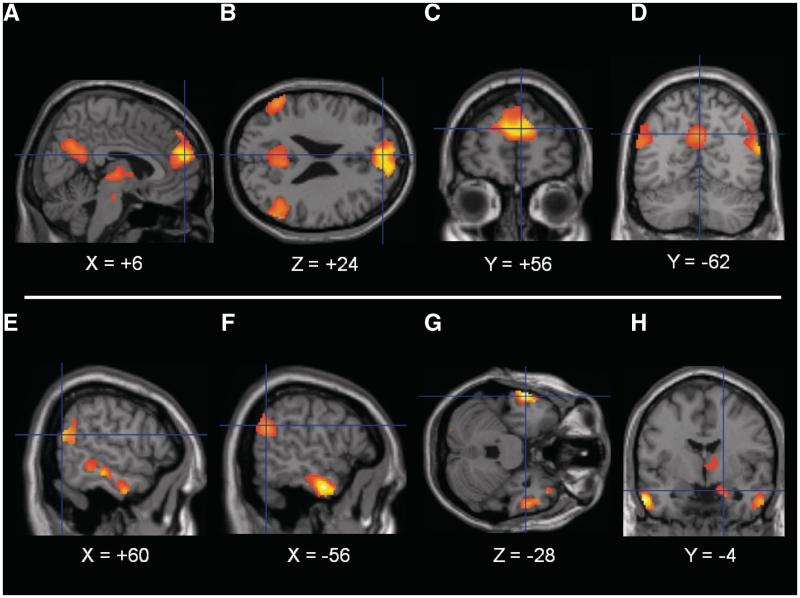
Fig. 1.
Main effect of social emotional processing. Note: Main effect contrast of: [(negative social + positive social) – (negative non-social + positive non-social)]. Presented at pWBC < 0.05 two-tailed (FDR), after exclusive masking by ANOVA [also pWBC < 0.05 (FDR)]. (A) Sagital image of DMPFC (crosshairs), thalamus, PCC/P, (B) transverse image of DMPFC (crosshairs), PCC/P, and bilateral TPJ, (C) coronal image of DMPFC, (D) coronal image of PCC/P (crosshairs) and bilateral TPJ, (E) sagital image of right TPJ (crosshairs), TP and middle temporal gyrus, (F) sagital image of left TPJ (crosshairs) and TP, (G) transverse image of Left TP (crosshairs) and Right TP and (H) coronal image of right amygdala (crosshairs), right thalamus, bilateral TP. Presented in neurological format where left of image is left in brain. Right of image on sagital and transverse slides is anterior. Coordinates in MNI space.

