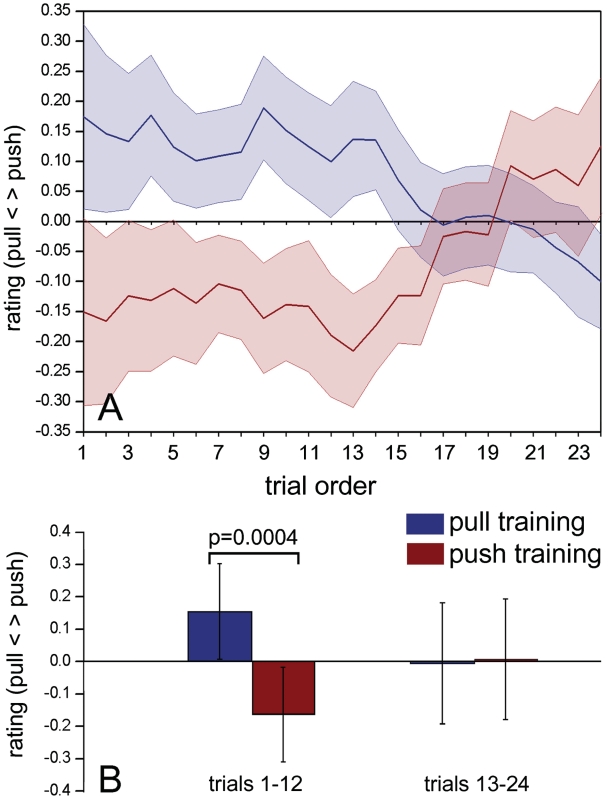
Fig. 2.
Time course of adaptation effect. (A) Mean values of the crude ratings for the ambiguous stimuli (contact point x = 0) in all 20 participants to the behavioral experiment sorted by order of appearance in the trials series. The shading represents ± SEM. (B) Results of the ANOVA between mean crude ratings of the first half of trials and the second half. The error bars indicate 95% confidence intervals.

