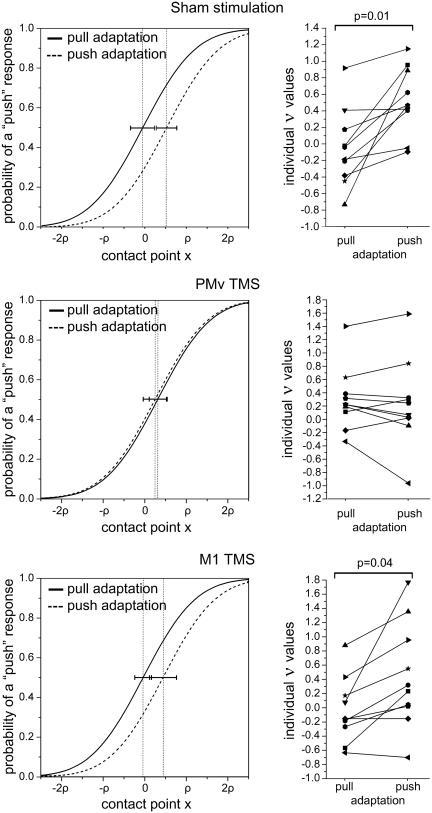
Fig. 5.
Results of TMS experiment. Left: grand-average of all the individual psychometric functions in the two adaptation conditions. The contact point x is expressed in units of participant's psychometric function slope ρ. The dotted vertical lines represent ν average values and horizontal error bars represent 95% confidence intervals. A shift of the psychometric curve towards the left indicates an increased probability of categorizing the stimulus as ‘push’. Vice-versa a shift to the right indicates a bias in favor of ‘pull’ responses. Right: individual values of ν for all 10 participants. The data for the three different TMS conditions are given. Note that ν indicates the stimulus value for which a participant is likely to respond at chance level. A negative value of ν indicates an increased probability of categorizing the stimulus as ‘push’. Vice-versa a positive value indicates a bias towards ‘pull’ responses. The P-values refer to significant Bonferroni corrected P-values of pairwise t-tests.

