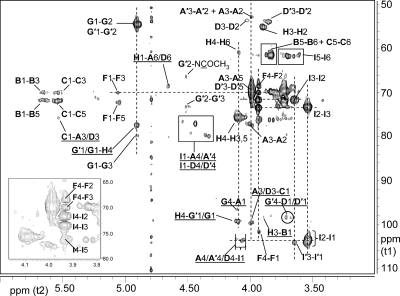
Fig. 8.
Partial 800-MHz 1H-13C HMBC spectrum of the B. cereus G9241 SCWP. Interresidue correlations defining all glycosidic linkages are underlined. Residues are in bold type and all connectivities are listed in the sequence: “proton-carbon”, e.g. G′1/G1-H4 designates a three-bond interresidue correlation between the anomeric proton of residue G and C4 of residue H, and the identical correlation between residues G′ and H. An expanded region showing weak interresidue HMBC correlations is shown in the Supplementary data.

