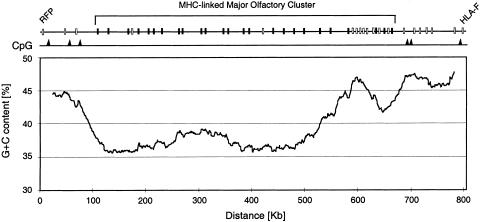
Figure 2.
G + C content plot of the MHC-linked major olfactory receptor (OR) cluster and immediate flanking regions. The mean G + C% (smoothed per 50-kb interval) is plotted per 1 kb at the midpoint of the interval starting at 25 kb. (Black boxes) OR loci, (white boxes) non-OR loci, (black triangles) positions of CpG islands. The average G + C content of the cluster is 37.83% (see also Table 2), defining it as a low G + C (L-family) isochore (Bernardi 1993).

