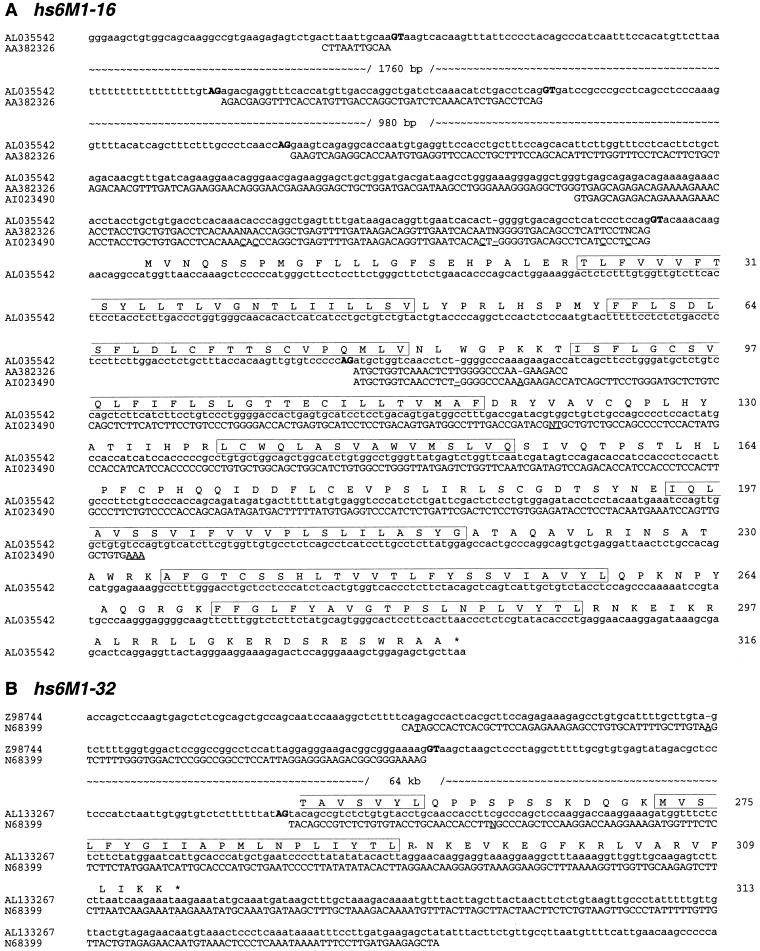
Figure 3.
Alignment of ESTs to the genomic sequences of (A) hs6M1-16, (B) hs6M1-32. AG/GT splice sites are highlighted in bold. Long intron sequences are not shown, but their sizes are indicated. The numbers on the right of the alignments refer to the conceptual amino acid positions of the unspliced protein. Positions of sequence disagreement are underlined and predicted transmembrane domains are boxed. Dashes were introduced where required to maximize the alignment. For more details, see Table 1.

