
Figure 4b.
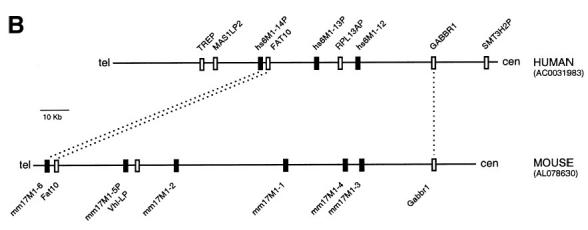
(Continued.) (B) Schematic summary of the human-mouse comparative analysis. OR loci are shown as black boxes and non-OR loci as white boxes. Orthologous gene loci are connected by dotted lines. 'cen' and 'tel' define directions towards centromere and telomere, respectively.