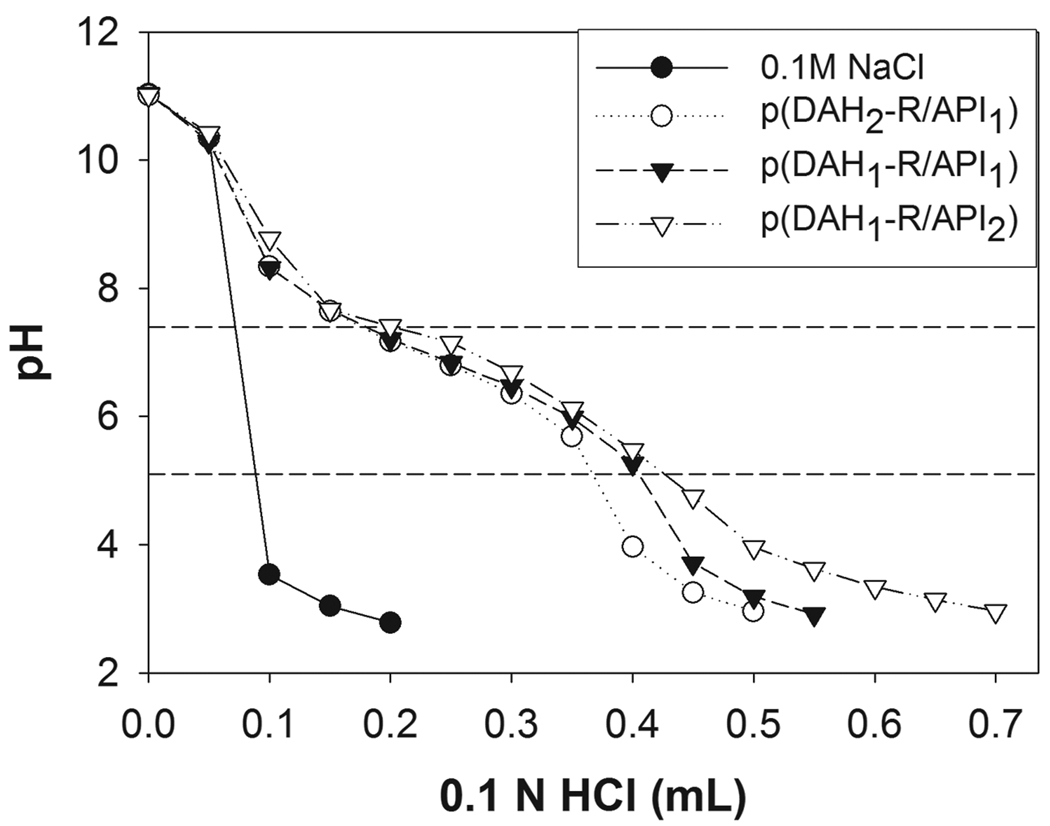
Figure 2.
Acid-base titration curve of p(DAH-R/API)s. 10 mg of each polymer was dissolved in 10 mL of 0.1 M NaCl solution, which was subsequently set to pH 11 using 1 M NaOH. The solutions were titrated to pH 3 with 0.1 M HCl. Titration curve of 0.1 M NaCl is presented as a control. Dashed lines indicate endosomal pH range (5.1 and 7.4).

