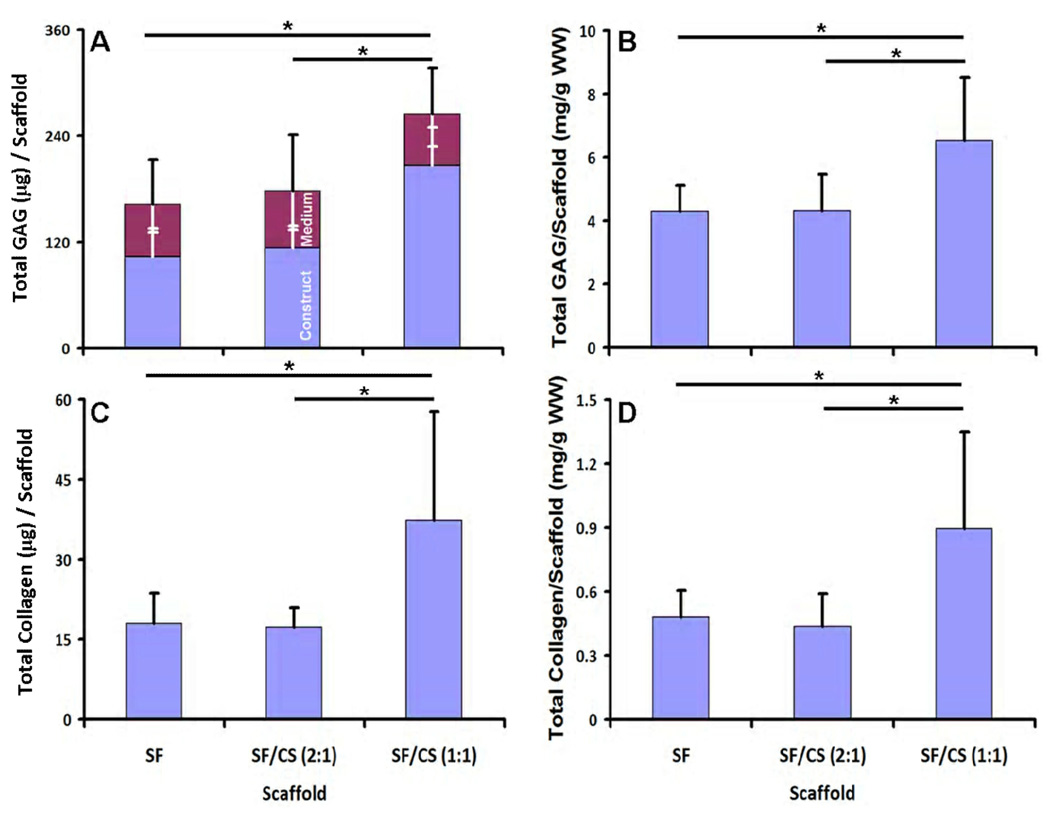
Figure 5.
GAG and collagen deposition by chondrocytes in SF, SF/CS (2:1), and SF/CS (1:1) constructs. Total GAG present in media and scaffolds and normalized GAG (A and B). Total collagen and normalized collagen in blended and silk scaffolds (C and D). Normalization of GAG and collagen was done by wet weight of the constructs after 2 weeks of culture. Each point represents the mean ± SD (n=6). * Significant differences between groups at p<0.05.

