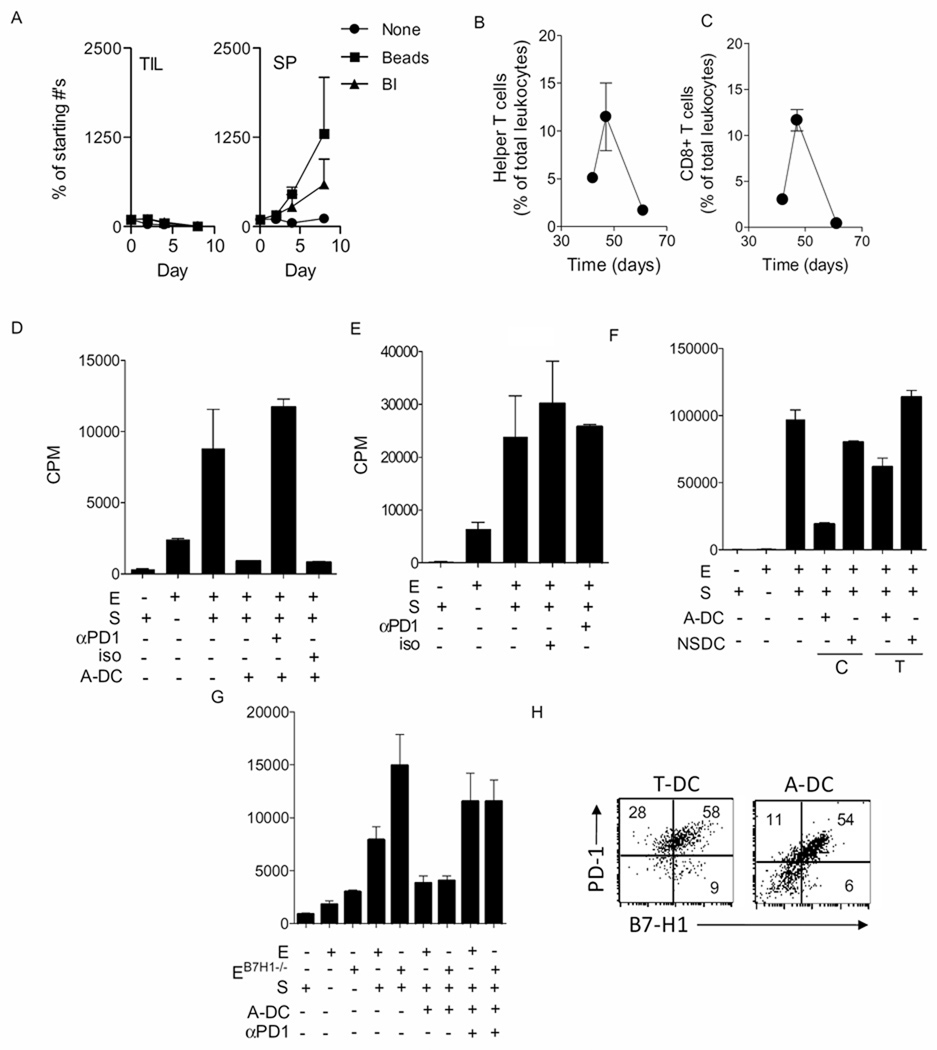
Figure 4. Ovarian cancer-associated DCs block T cell proliferation through PD-1 and in a contact-dependent manner.
Panel A shows numbers of tumor infiltrating lymphocytes derived from tumor (TIL-T) (left panel) and splenocytes (SP) (right panel) cultured in the presence/absence of bryostatin/ionomycin (BI) and antiCD3/CD28 beads. Each data point is the mean (±s.e.m.) of 3–4 determinations and the experiment is representative of 3 or 4 experiments. Panels B and C shows the mean (±s.e.m.) proportions of helper/regulatory and CTL/regulatory (i.e. CD3+CD4+ T cells and CD3+CD8+ T cells respectively) on days 42, 47, and 61. T cells are expressed as a % of total leukocytes. Shown are the means (±s.e.m.) of 2–3 replicates. Panels are representative of 3 independent experiments. Panel D shows tritiated thymidine incorporation into effectors cells in an MLR assay in the absence or presence of A-DC. Some wells also contained either anti PD-1 antibody (αPD1) or an isotype control antibody (iso). Panel E shows titrated thymidine incorporation into effector cells in the wells containing either anti-PD-1 antibody (αPD1) or an isotype control antibody (iso). Panel F shows thymidine incorporation into effectors in the presence or absence of A-DC or NSDC. The DCs were either in direct contact (C) with the effectors or were separated by a transwell membrane (T). Panel G shows thymidine incorporation into effectors derived from normal B6 mice or B7-H1 knockout mice (B7H1−/−) in the presence or absence of A-DC and anti-PD-1 antibodies. In all panels, each bar is the mean and s.e.m. of three replicates. The experiment is representative of three similar experiments. Panel H shows dot plots of tumor (T)- or ascites (A)-associated DCs, respectively, at day 47 following tumor challenge, stained for B7-H1 on the x-axis and PD-1 on the y-axis. Inset numbers are the percentages for the respective quadrants. Cells were gated on CD11c.

