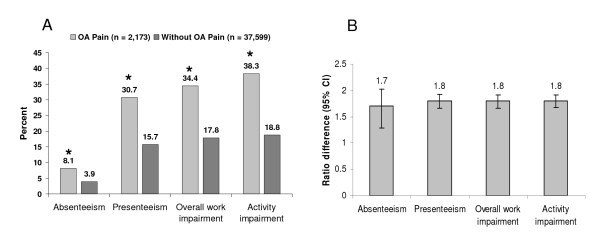
Figure 3.
Work productivity evaluated using the Work Productivity and Impairment (WPAI) questionnaire. A) Percent work activity impairment. *P < 0.0001 versus controls. B) Impact of impairment; the ratio difference indicates the magnitude of impairment for workers with OA pain relative to workers without OA pain. All values are adjusted for covariates. *P < 0.0001 for all ratio differences.

