Figure 3.
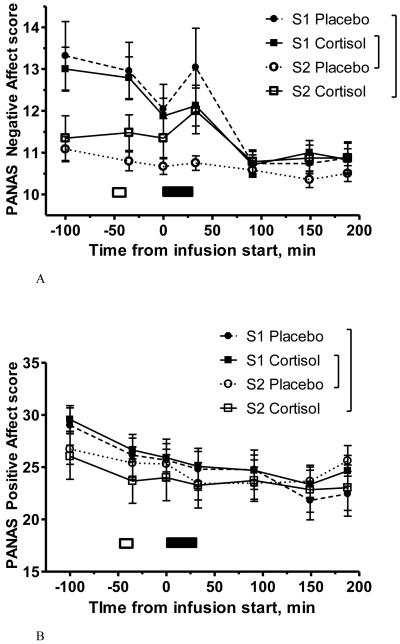
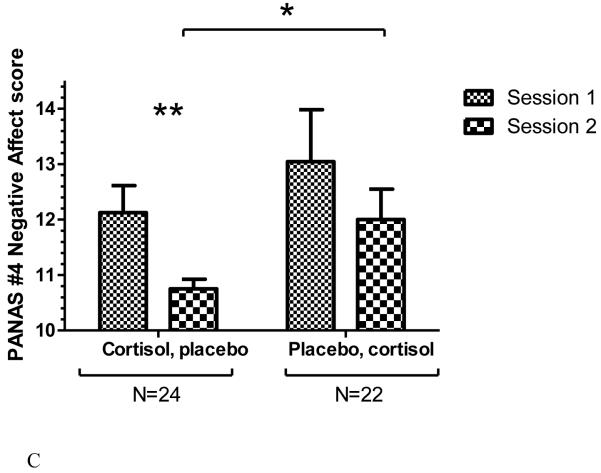
PANAS-NOW negative affect (NA; Figure 3A) and positive affect (PA; Figure 3B) scores at each of the seven measurement points throughout the study sessions, by drug and session (S1 = Session 1; S2 = Session 2). Error bars represent SEM. White bars indicate placement of intravenous lines; black bars indicate infusion. The Picture Task occurred during the latter half of the infusion (black bar). “Cortisol-first” group, N=24; “placebo-first” group, N=23. Figure 3C shows PANAS NA scores at PANAS administration #4, immediately after the Picture Task, by drug and session. Error bars represent SEM. Left, participants who received cortisol in Session 1 and placebo in Session 2; right, participants who received placebo in Session 1 and cortisol in Session 2. * indicates significant difference in post-hoc test, p < 0.05; ** indicates p < 0.01. There is no significant difference between Session 1 and 2 NA in the group who received placebo first (right two bars).


