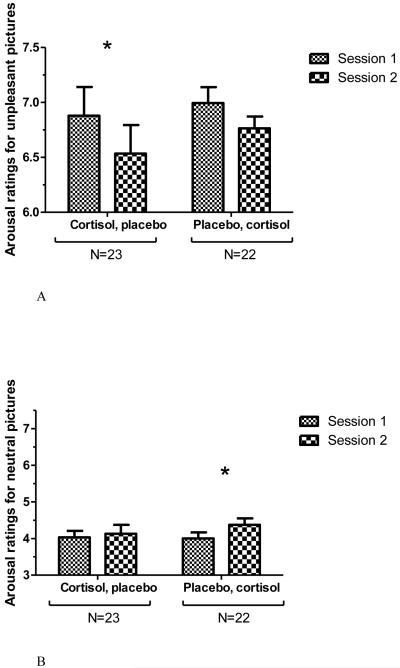
Figure 4.
Average arousal ratings for unpleasant (Figure 4A) and neutral (Figure 4B) IAPS pictures in the Picture Task, by drug and session. Error bars represent SEM. Left, participants who received cortisol in Session 1 and placebo in Session 2, N=23. Right, participants who received placebo in Session 1 and cortisol in Session 2, N=22. * indicates significant difference in post-hoc test, p < 0.05. In Figure 4A (ratings for unpleasant pictures), post-hoc test indicates a trend level difference between Session 1 and Session 2 arousal ratings for those who received placebo first, p < 0.06.

