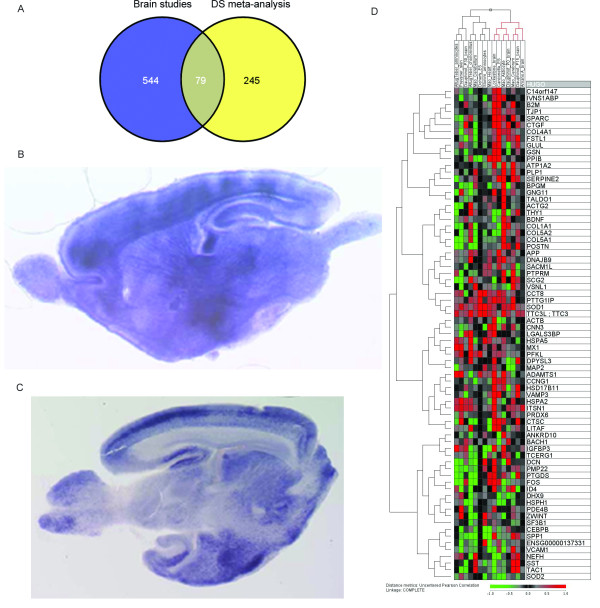
Figure 3.
Brain-related dosage effects. A) Venn diagram showing the overlap of the 324 significant genes with 623 genes identified by independent mouse studies related to brain phenotypes; B) RNA in situ hybridisations of BACH1 in postnatal mouse embryonic brain slices. C) In situ hybridisation of TTC3 in the same tissue. Images kindly provided by the HSA21 consortium ([4]; http://chr21.molgen.mpg.de/hsa21). D) Hierarchical clustering of 79 genes related to non-DS general brain disorders with the DS gene expression data sets. Clustering was performed with the J-Express 2009 software using Pearson correlation as similarity measure and complete linkage as update rule.

