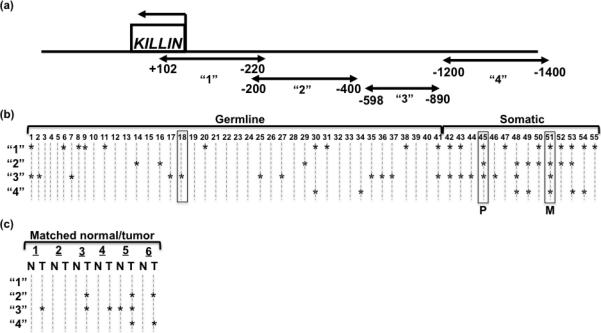
Figure 1. Germline and somatic DNA methylation of PTEN/KILLIN regulatory region in RCC patients and tumors.

(a) The schematic shows the KILLIN gene in relationship to the methylated regions analyzed depicted by the arrow-ended lines. (b) Combined Bisulfite Restriction Analysis (COBRA) was used on germline DNA from 41 ccRCC patients, 13 primary tumor tissue specimens, one metastatic tumor specimen, and 50 unaffected individuals. From all of the patient specimens, three were matched from one individual: one germline sample (#18), one primary tumor (#45), and one metastatic tumor (#51). (COBRA gels shown in Supplemental Figure 1). The results of the COBRA analysis are displayed in this plot, where “*” indicates methylation in that region for that sample. “1” is the region spanning +102bp to -220bp, “2” is the region spanning -200bp to -400bp, “3” is the region spanning -598bp to -890bp, and “4” is the region spanning -1200bp to -1400bp. Samples enclosed in boxes indicate specimens from the same individual. “P” indicates primary tumor, “M” indicates metastatic tumor. “Germline” specimens are obtained from the leukocytes of ccRCC patients, while “Somatic” DNAs are acquired from the ccRCC tumors. (c) COBRA analysis on 6 paired normal/tumor specimens from ccRCC individuals are displayed in this plot, where “*” indicates methylation in that region for that sample. Regions “1” through “4” are denoted above under (a). “N” represents normal and “T” represents tumor.
