


Figure 1.
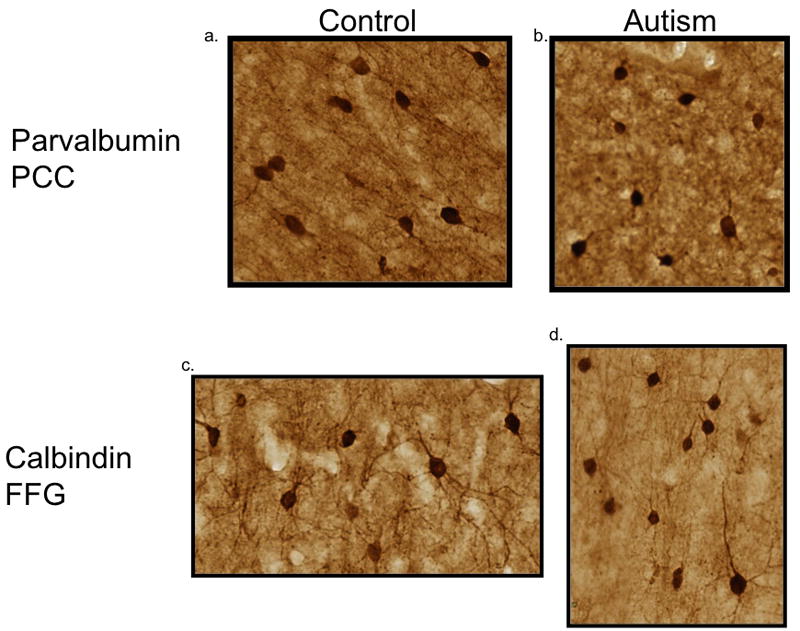
Neuron and interneuron density in the fusiform gyrus. There was no change in the density of thionin stained neurons in the FFG. The density and percent of calbindin (b,c) and parvalbumin (d,e) was not changed between the autism and control groups. Each symbol is representative of a single case.