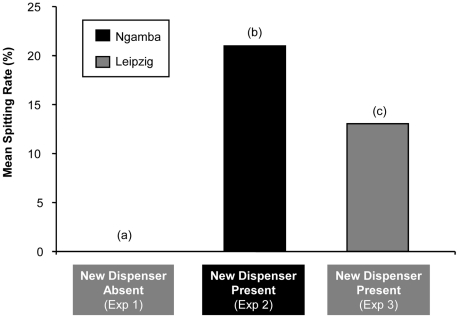
Figure 3. Mean spitting rate for each group = Sum of the individual spitting rates divided by number of subjects in each group.
(a): 19 subjects from Leipzig tested with the new dispenser absent, (b): 25 subjects from Ngamba tested with the new dispenser present. (c): 16 subjects from (a) plus 3 new subjects from Leipzig tested with the new dispenser present.

