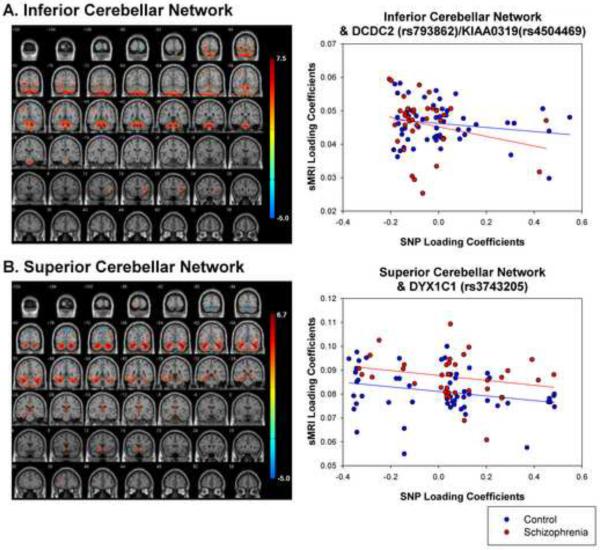
Figure 2.
sMRI networks for (A) inferior and (B) superior cerebellar network. Scatterplots show relationship between loading coefficients for sMRI and SNP components. Inferior Cerebellar network was related to a SNP component that showed the strongest loadings for DCDC2 (rs793862) and KIAA0319 (rs4504469). Superior Cerebellar network was related to a SNP component that showed the strongest loadings for DYX1C1 (rs3743205).

