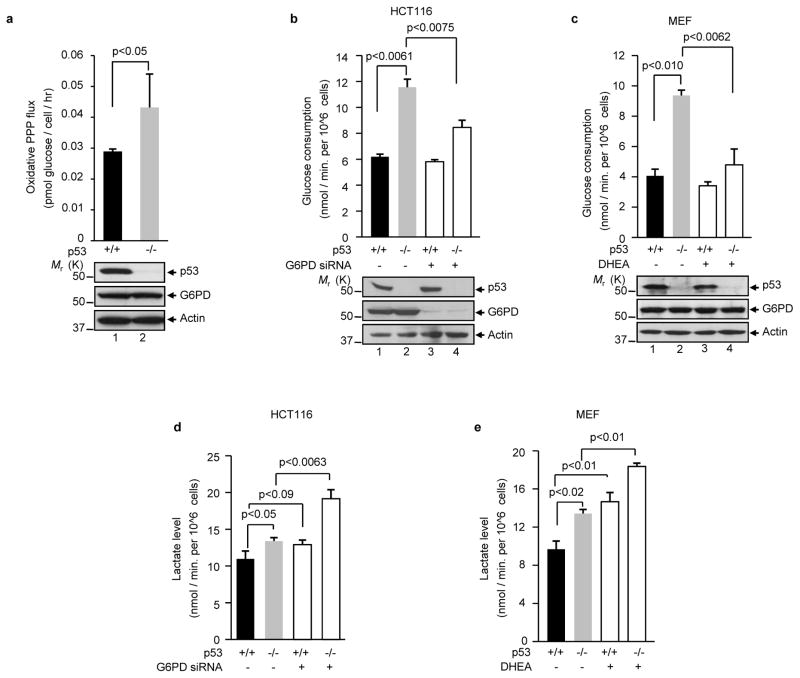
Figure 1. p53 deficiency correlates with increases in PPP flux, glucose consumption, and lactate production.
(a) p53+/+ and p53−/− HCT116 cells were cultured in medium containing [2-13C]glucose. Oxidative PPP flux (top) was measured based on the rate of glucose consumption and the ratio of 13C incorporated in to carbon 2 (indicating glycolysis) and carbon 3 (indicating PPP) of lactate by NMR spectroscopy. Molecular weight standards (Mr, in kDa) are indicated on the left. Data shown are means ± S.D. (n=3).
(b, d) p53+/+ and p53−/− HCT116 cells were treated with G6PD siRNA and control siRNA (−). Glucose consumption (b, top) and lactate levels (d) are expressed as mean ± standard deviation (SD) of three independent experiments. The expression of p53, G6PD, and actin (a loading control) is shown at the bottom of (b).
(c, e) p53+/+ and p53−/− MEF cells were treated with 1 mM DHEA or vehicle (−) for 24 h. Glucose consumption (c, top) and lactate levels (e) are measured. Protein expression is shown at the bottom of (c). Data are means ± S.D. (n=3).

