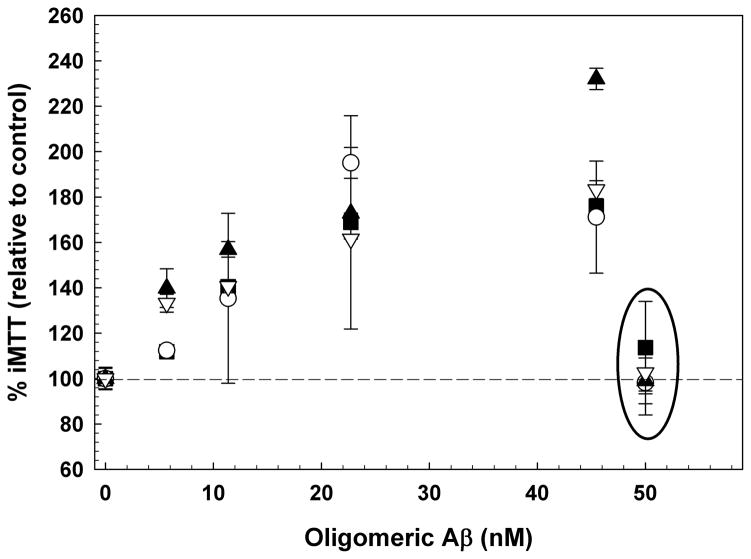
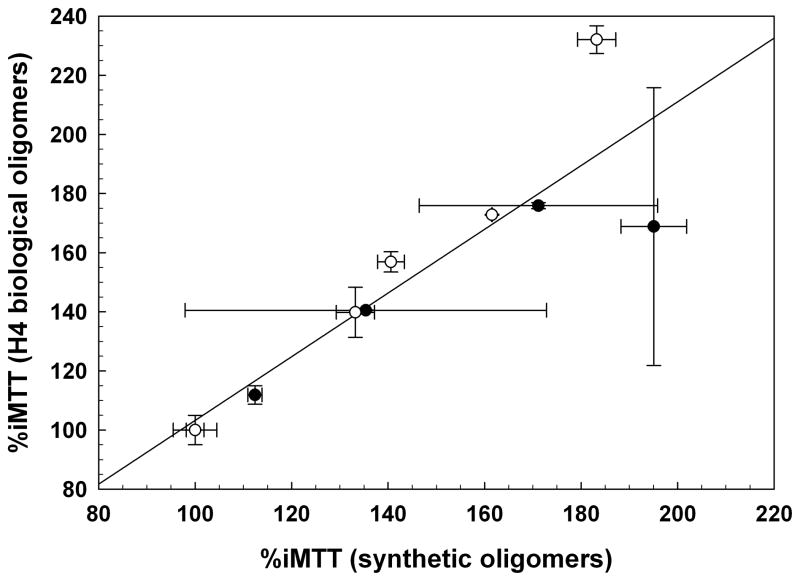
Figure 3.
(A) Dose-dependent increase of iMTT in response to oligomeric Aβ, but not monomer (50 nM; circled); N=3. SH-SY5Y cells with biological oligomers (closed squares); SH-SY5Y cells with synthetic oligomers (open circles); C2C12 cells with biological oligomers (closed triangle); C1C12 cells with synthetic oligomers (open inverted triangles). (B) Data from the dose-response experiment in (A) plotted as a correlation between the responses elicited from synthetic Aβ oligomers versus biological Aβ oligomers. The diagonal line indicates a linear fit to all of the data on the plot (slope = 1.07; r2 = 0.795). SH-SY5Y (closed circles); C2C12 (open circles). Biologically derived and synthetic oligomeric Aβ elicit essentially the same effects.


