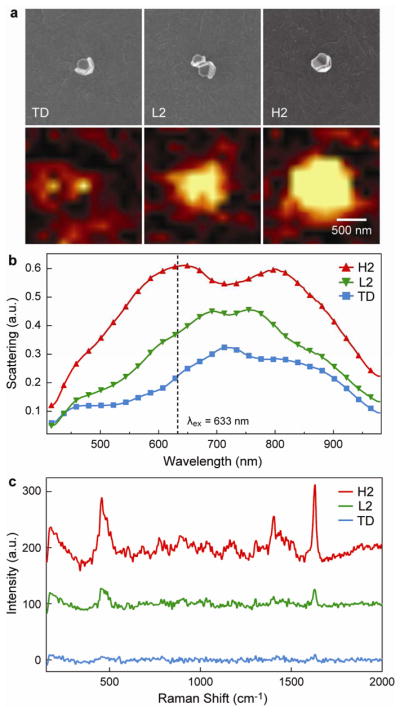
Figure 3. Correlation of the DF scattering and SERS response of single nanopyramids and dimers.

(a) (top) SEM and (bottom) corresponding Raman images of the 1621–1624 cm−1 MB vibrational mode intensity from a single tip-down pyramid (TD), a low-order dimer of pyramidal nanoshells (L2), and a high-order dimer of pyramidal nanoshells (H2). The scale bar applies to all images. (b) DF scattering spectra of TD, L2, and H2. (c) Raman spectra corresponding to the most intense point of the Raman image in (a).
