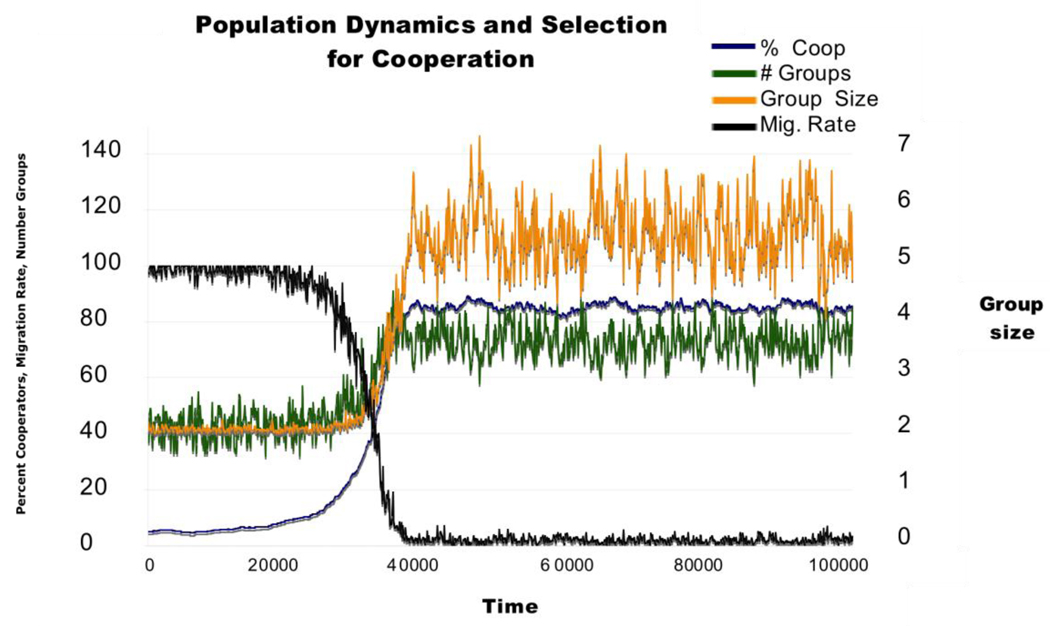
Figure 7.
The evolutionary transition from low to high levels of cooperation (blue line) is mirrored by a spatial transition from high to low rates of migration (black line), more groups (green line) and larger group size (yellow line). This plot shows the changes in each variable over the first 100,000 time periods of a run with cooperator and defector thresholds of 0.7. Percent cooperators, migration rate and number of groups are indicated on the left axis and group size is indicated on the right axis.

