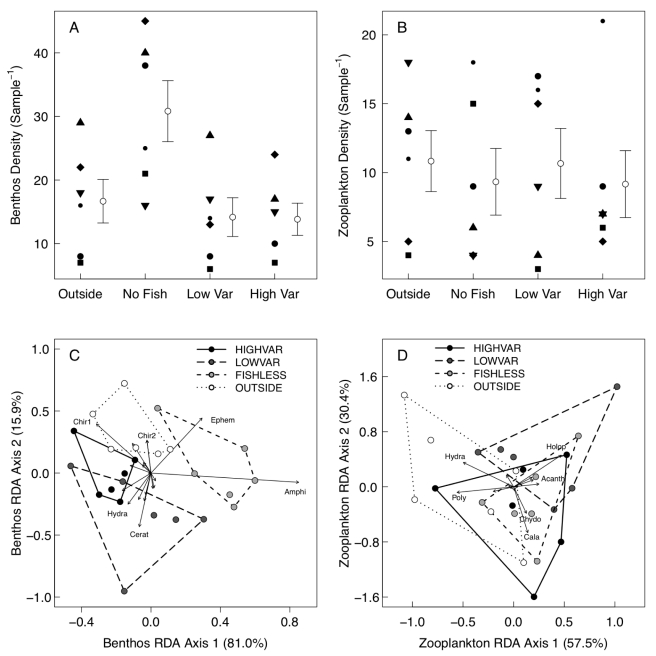
Figure 2. Effects of enclosures, stickleback presence and stickleback size variance on the prey community.
Shown are densities of a) benthic invertebrates and b) zooplankton (Mean  1 SE), and taxonomic composition of c) benthic invertebrates and d) zooplankton. The lower panels present the first two axes from redundancy analyses, showing the percentage of variance explained by each axis. Treatments are indicated both by shading of points and the line style of convex hulls. Arrows indicate the position of individual prey taxa in coordinate space; for clarity, only the six taxa farthest from the origin in each panel are labeled. Chir1 = chironomid larvae, subfamily chironominae; Chir2 = chironomid larvae, subfamily tanypodinae; Cerat = ceratopogonid larvae; Ephem = ephemeroptera larvae; Amphi = amphipod; Hydra = hydracarinid mite; Cala = calanoid copepod; Holop = Holopedium gibberosum; Acanth = Acantholebris sp.; Chydo = Chydoris sp.; Poly = Polyphemus sp.

