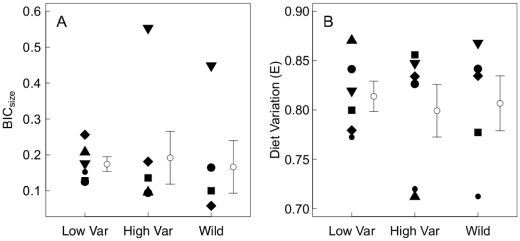
Figure 4. Effect of stickleback size variance on population-level diet variation.
a) variance in mean prey size among individuals (BIC ) and b) mean pairwise diet dissimilarity based on prey frequency data (E). Symbols correspond to spatial blocks, and ÒwildÓ samples correspond to fish caught outside five of the six blocks. Mean
  1 SE.
1 SE.

