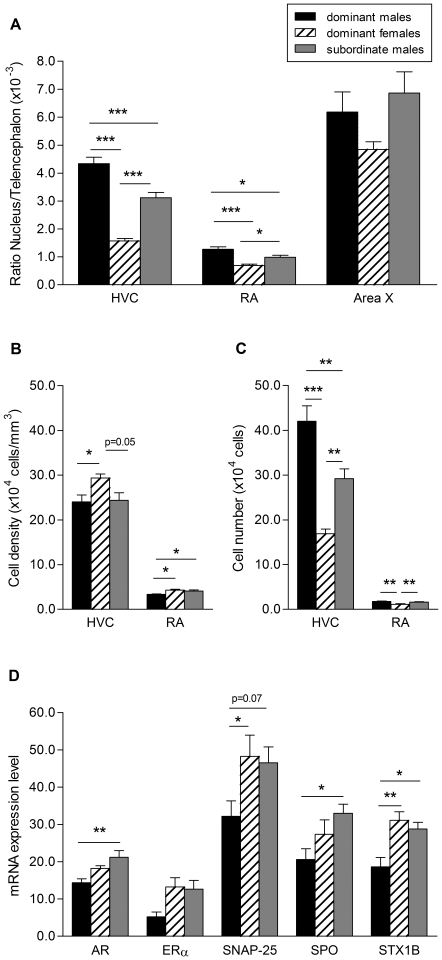
Figure 3. Sex differences in gross-morphological and cytochemical features of the vocal control system between dominant males and females and subordinate males.
Ratio nucleus volume/telencephalon volume (A), cell density (B) and cell number (C) of song control nuclei HVC and RA. D: mRNA expression levels (fractional area covered by silver grains) of AR, ERα, SNAP-25, SPO and STX1B in HVC; (***p<0.001, **p<0.01, *p<0.05).

