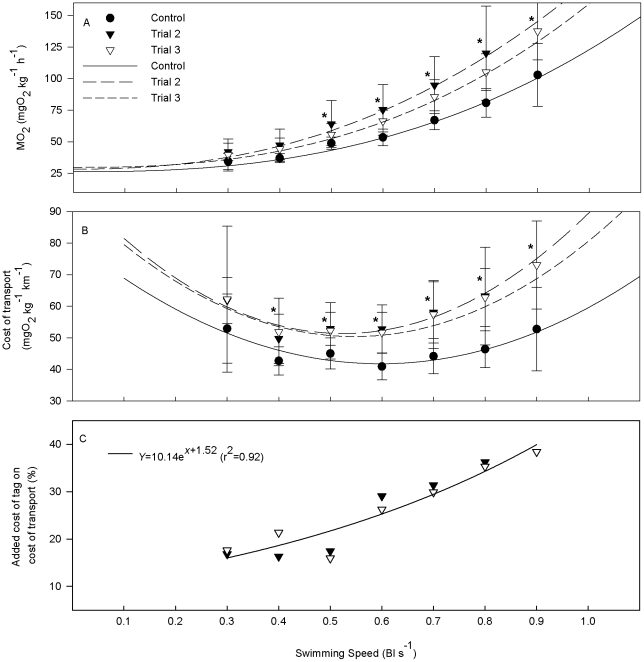
Figure 2. Swimming energetics in (A. anguilla) with a PSAT dummy.
A. Oxygen consumption (MO2, mgO2 kg−1 h−1) and B. Cost of transport (COT, mgO2 kg−1 km−1) as a function of swimming speed (U, Bl s−1) swimming with and without a PSAT dummy. Swim trials without (control) and with a tag (trials 2, 3) were performed on the same individual (N = 9). Lines are regression lines (refer to Table 1 for regression values). An asterisk denotes significant difference between control and tagged condition (Repeated measures ANOVA, p<0.05). Data are presented as mean±SD. C. Additional cost of tag on COT as a function of swimming speed (U, Bl s−1). Line is regression line of the average value of trials 2 and 3.

