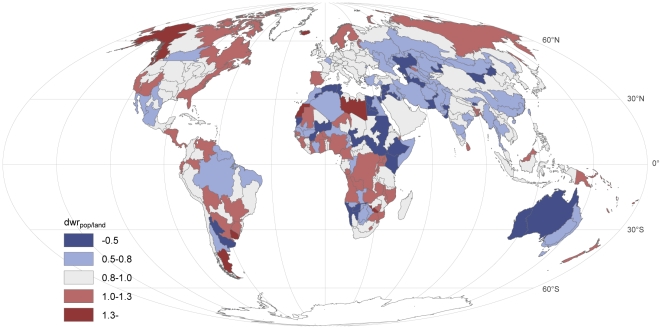
Figure 5. Ratio (dwrpop/land) of ‘population distance to water’ (dwpop) over the ‘land distance to water’ (dwland) by FPUs (for regional results see Table 4 ; Supporting Information S2).
In areas where the ratio is smaller than 1, people live relatively close to water as the average dwpop is lower than the average dwland in that FPU. For areas with a ratio greater than 1, on the other hand, the opposite is the case and people live relatively far from freshwater sources. The thresholds are derived from the statistical analysis as follows: dwrpop /land is between 0.5–1.3 for 95% of the cases, and between 0.8 and 1.0 in 50% of the cases (i.e. the grey values represent FPUs within this 50% interval).

