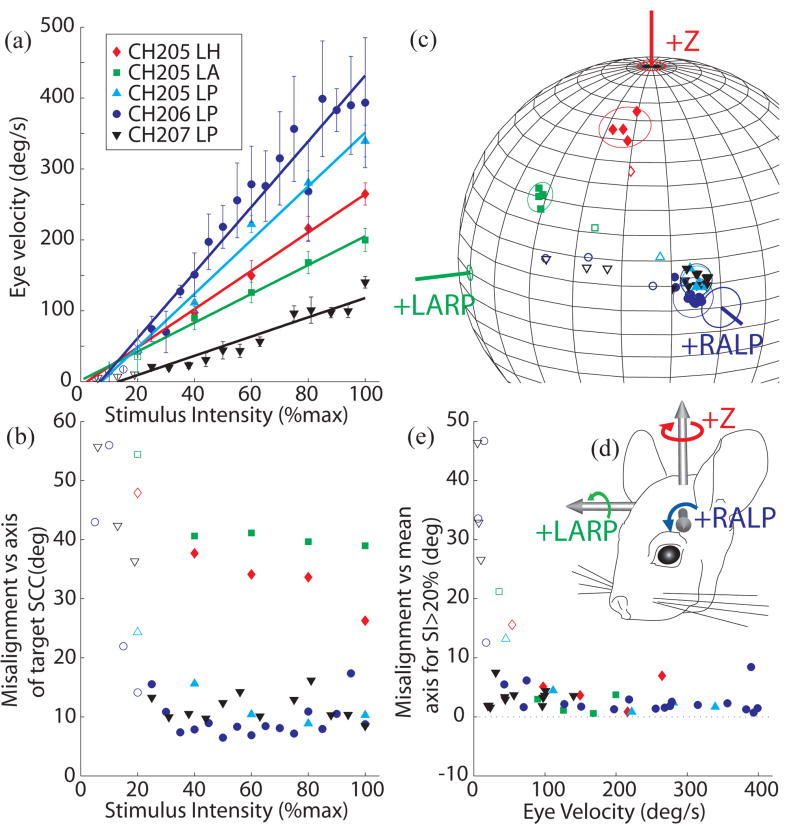
Fig. 3.
Peak excitatory response eye velocity (A) and misalignment (B) as a function of stimulus intensity for 5 implanted SCCs. In each case, pulse frequency modulation (PFM) of biphasic current pulses was used to encode a virtual sinusoidal head velocity at 2 Hz as described in text. Stimulus intensity (SI) of 100% corresponds to PFM about a baseline of 60 pps up to 400 pps and down to 0 pps. SI<100% implies a proportional decrease in pulse rate excursion about the baseline. In all cases, VOR response eye velocity increased almost linearly with increasing SI (R2>0.94 for each case), while misalignment between the desired and observed VOR axes remained relatively constant for SI>20%. (C) Axes of responses for each SCC tested cluster tightly in each case about a constant axis for SI>20% (solid symbols) but depart from that axis for lower SI (open symbols). Circles around the data points represent 3 standard deviations of misalignment angle beyond the mean axis of responses for SI>20%. Angle measurement error for each SCC axis (depicted in (D) in reference to an animal head) is based on animal measurements [58]. (E) To more clearly depict the consistency of the misalignment across eye response velocities, misalignment with respect to mean response axes to stimuli with SI>20% for each SCC is plotted against eye velocity. Axis of rotation remains relatively constant for peak excitatory eye responses>50°/s.

