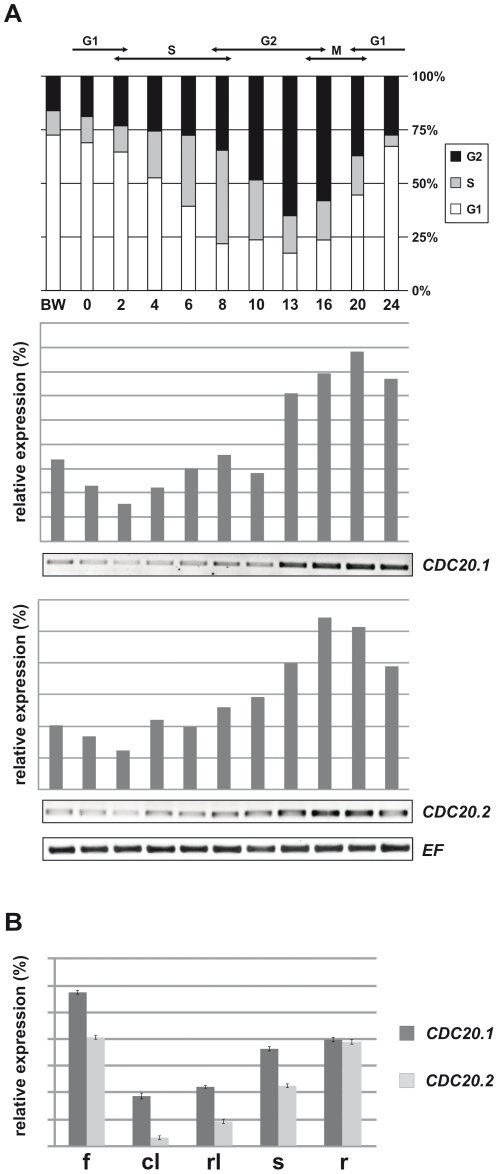
Figure 4. Expression of AtCDC20.1 and AtCDC20.2 in synchronized Arabidopsis cell culture and different plant organs.
(A) Expression of AtCDC20.1 and AtCDC20.2 during the cell cycle. The diagram shows the progression of the cell cycle after aphidicolin block and distribution of the cells at distinct phases of cell cycle (G1, S, G2, M) (BW, before aphidicolin wash; 0–24, hours after removal of the aphidicolin). The RT-PCRs show the relative expression of AtCDC20.1 and AtCDC20.2 genes normalized to the expression of elongation factor (EF), used as a constitutive marker, in function of time (0–24 hours) after the release from the aphidicolin block. (B) Relative expression of the AtCDC20.1 and AtCDC20.2 genes in flowers (f), cauline leaves (cl), rosette leaves (rl), stems (s) and roots (r) by RT-qPCR normalized to the expression level of the EF constitutive marker.

