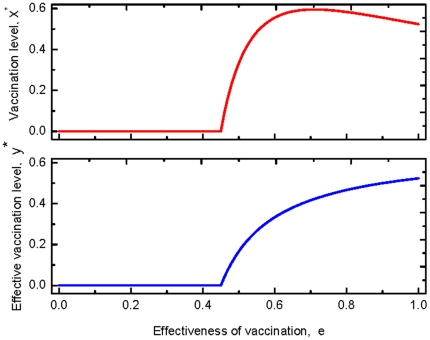
Figure 2. Fractions of the vaccinated and the effective vaccinated for a disease with a moderate infectiveness.
The upper panel shows the stationary frequency of the vaccinated with respective to the effectiveness. No one takes vaccination until it is sufficiently efficient,  . Then the vaccine uptake level increases with the effectiveness. When the effectiveness exceeds a threshold,
  , however, the vaccination level decreases with the effectiveness. The lower panel shows the stationary abundance of the effectively vaccinated individuals with respect to the effectiveness. It is shown the efficient vaccinated individual increases with the effectiveness all the time. Thus the behavior of vaccination and the impact of the vaccination against epidemic are not in agreement: for high effectiveness, even though vaccination rate is decreasing, the number of effectively vaccinated individual increases as the effectiveness
  increases. Here
  ,
,  satisfying
  .
.

