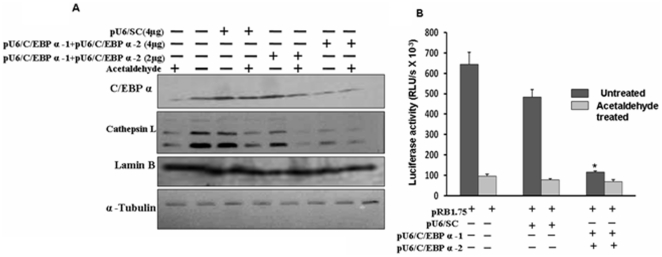
Figure 7. Silencing of C/EBP α expression simulate the effect of acetaldehyde.
(A). Simulation of the effect of acetaldehyde treatment on CTSL expression by Silencing of C/EBP α expression. HepG2 cells transfected with 2.0 or 4.0 µg of C/EBP α si RNA expression vectors ( pU6-C/EBPα-1+pU6-C/EBPα-2 ) or 4.0 µg of scrambled Si RNA expression vector(pU6-SC) were cultured in the presence or absence of 5 um acetaldehyde as described in figure 3. After 24 hours the cells were lysed and levels of C/EBP α, CTSL, lamin B and α tubulin were detected by western blotting using specific antibodies. The cell lysates prepared from untransfected, untreated or treated with acetaldehyde cells were also subjected to western blotting using the above mentioned antibodies and served as control. Each blot shown is a representative of at least three separate experiments. (B). Silencing of C/EBP α expression simulates the effect of acetaldehyde treatment on CTSL promoter activity. HepG2 cells co transfected with 1.0 µg of pRB-1.75 and 4.0 µg of C/EBP α si RNA expression vectors ( pU6-C/EBPα-1+pU6-C/EBPα-2 ) or scrambled Si RNA expression vector(pU6-SC) were cultured in the presence or absence of 5 µM acetaldehyde as described in figure 3. After 24 hours the cells were lysed and luciferase activity was assayed. Each transfection was done in triplicates and results are expressed as mean ± SD from three independent experiments. Values significantly different from control has been marked by *.

