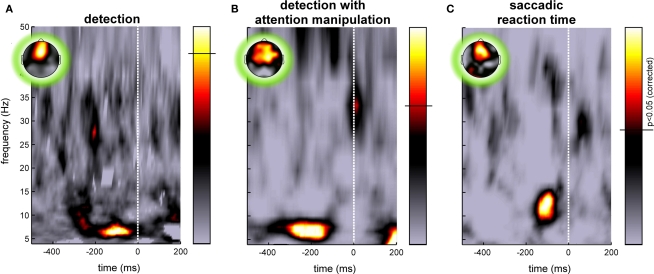
Figure 2.
Examples of pre-stimulus EEG phase influences on behavioral response variability. Each image illustrates the significance of a relation between the phase of ongoing EEG oscillations and a subsequent behavioral response recorded on the same trials, for various frequency bands (y-axis) and at different pre-stimulus times (x-axis). Time zero marks the (unpredictable) onset of the stimulus. The colorbar represents p-values, with the significance threshold marked by a horizontal line (p < 0.05, corrected for multiple comparisons across time and frequency points using the FDR procedure). The insets illustrate the topography of the effect at the optimal time–frequency point. (A) The response specified whether or not the observer had perceived a peripheral flash of light. The influence of phase was measured by comparing the phase-locking computed for two groups of trials corresponding to perceived and unperceived stimuli to surrogate phase-locking values obtained under the null hypothesis (random permutation of behavioral responses). At ∼7 Hz and 100–200 ms before the stimulus appears, the phase of frontal EEG on each trial was strongly predictive of the perceptual outcome (Busch et al., 2009). (B) In a separate experiment, observers again reported their perception of a flash of light, but the focus of spatial attention was manipulated with a cueing procedure. A significant relation between ongoing EEG phase and trial-by-trial perception was recorded only when the target was flashed at the attended location. Here the image illustrates the significance of a circular-to-linear correlation between pre-stimulus phase (the circular variable) and post-stimulus global field power (GFP, a linear variable which we used as a marker of subjective perception; indeed, this GFP was virtually zero when the target was undetected). As in the previous case, the EEG phase at ∼7 Hz, recorded 100–400 ms prior to stimulus onset on frontal electrodes, was maximally predictive of target perception (Busch and VanRullen, 2010). (C) In another study, pre-stimulus phase was linked to the subsequent saccadic reaction time (here for a choice discrimination task between two shapes presented left and right of fixation). Reaction times for each subject were binned in five quintiles, and phase locking for each quintile was compared statistically with surrogate phase-locking values obtained under the null hypothesis (i.e., using the same number of trials but randomly drawn, regardless of reaction time). A strongly significant phase-locking increase was again observed on frontal electrodes around 100 ms pre-stimulus, but this time at a frequency of ∼13 Hz. Note that in this experiment, time zero corresponds to the beginning of the first stimulus-locked event, a “gap” or disappearance of the fixation point, the choice display itself being presented only after 200 ms (Drewes and VanRullen, 2011).

