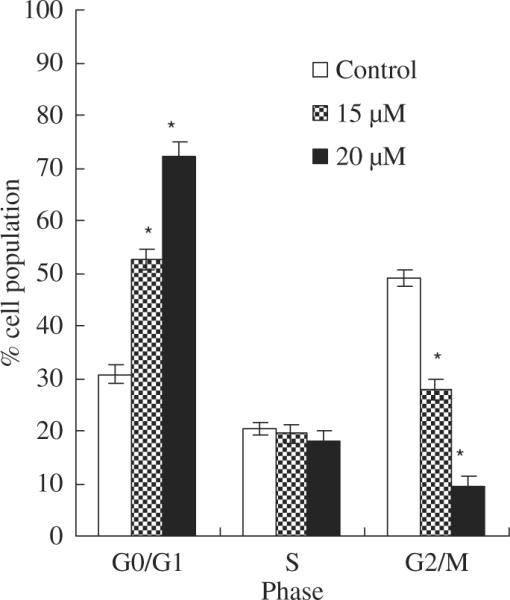
Fig. 3.

The effects of asperfuranone on cell cycle distribution in A549 cells. A549 cells after treatment with vehicle alone (0.1% DMSO) and asperfuranone (15 and 20 μM) for 24 hr were fixed and stained with propidium iodide, and cell cycle distribution was then analysed by flow cytometry. Each value is the mean ± S.D. of three determinations. The asterisk indicates a significant difference between control and asperfuranone-treated cells, as analysed by Dunnett's test(p < 0.05).
