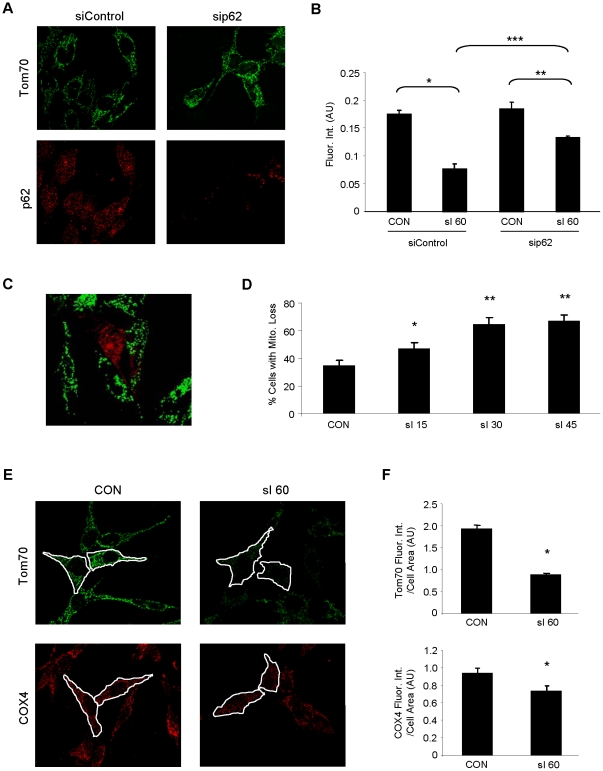
Figure 7. Depletion of p62 attenuates sI-induced mitochondrial loss.
A. HL-1 cells were treated with scrambled siRNA (siControl) or siRNA corresponding to p62 (sip62) and labeled with antibodies to Tom70 (green) and p62 (red). B. HL-1 cells treated with siRNA were subjected to sI for 60 min and mitochondrial mass was quantified by fluorescence intensity of the mitochondrial marker Tom70. Over 100 cells were assessed for each group and the experiment was performed 3 times. Error bars represent SEM of the 3 experiments (ANOVA: *p<0.001, **p<0.05, ***p<0.005). C. Shown is a representative deconvolved image of HL-1 cells transfected with mCherry-Parkin (red) and subjected to sI for 30 min and probed for Tom70 (green). D. Mitochondrial content in mCherry-Parkin-transfected cells was assessed by fluorescence intensity of Tom70, and the percentage of cells showing substantial mitochondrial loss (similar to the cell depicted here in the center of the field) was scored for non-ischemic cells (CON) and time points of 15, 30 and 45 min of simulated ischemia. A minimum of 100 transfected cells were scored for each time point (ANOVA: *p<0.01, **p<0.001 versus CON, n = 4). Error bars represent SEM of the 4 experiments. E. Mitochondrial content per cell was assessed in HL-1 cardiomyocytes subjected to 60 min of sI. The total amount of green (Tom70, outer mitochondrial membrane marker), and red (COX4, inner mitochondrial membrane marker) fluorescence intensity per unit area within each cell were measured (ImageJ). F. For each condition, 100 cells were scored in sequential fields (*p<0.01, n = 4).

