Figure 4.
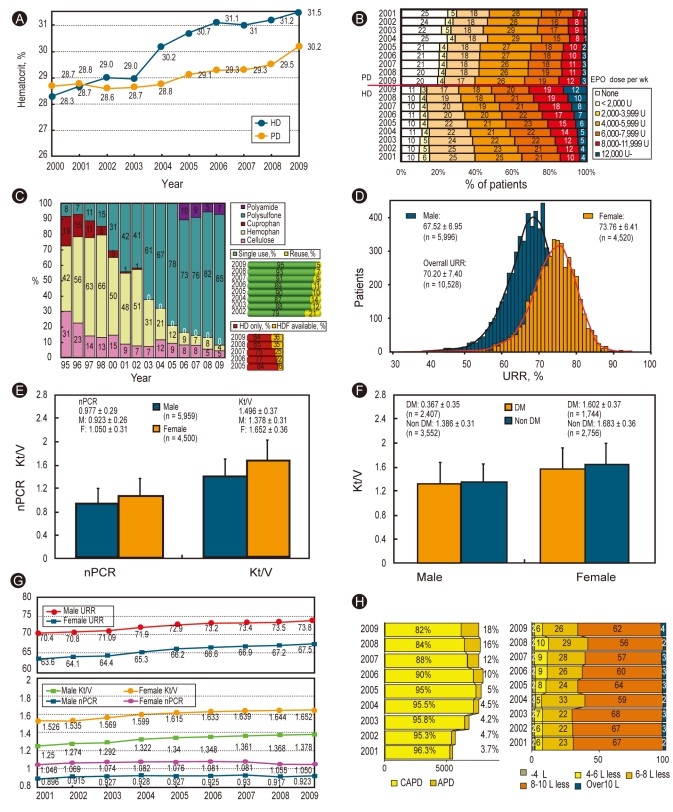
Erythropoietin therapy, hemodialysis (HD) and peritoneal dialysis (PD) therapy characteristics. (A) Changes in hematocrit (%) in patients undergoing dialysis: HD vs. PD. Note the increase in the hematocrit of patients undergoing HD. (B) Percent distribution of erythropoietin (EPO) doses prescribed for patients undergoing HD and PD. (C) Currently using HD membrane and dialysis membrane reuse and percentage of hemodiafiltration (HDF) in private clinics. (D) Distribution of the urea reduction ratio (URR) in patients undergoing HD. Note the difference between males and females. (E) Dialysis adequacy parameters (nPCR and Kt/V) of patients undergoing HD. (F) Dialysis adequacy parameters (Kt/V) for patients with diabetes mellitus (DM) and nonDM who were undergoing HD. (G) Annual changes in dialysis adequacy parameters for patients undergoing HD. (H) Percent distribution of peritoneal dialysis type and doses (2009, n = 2,836). CAPD, continuous ambulatory peritoneal dialysis; APD, automated peritoneal dialysis.

