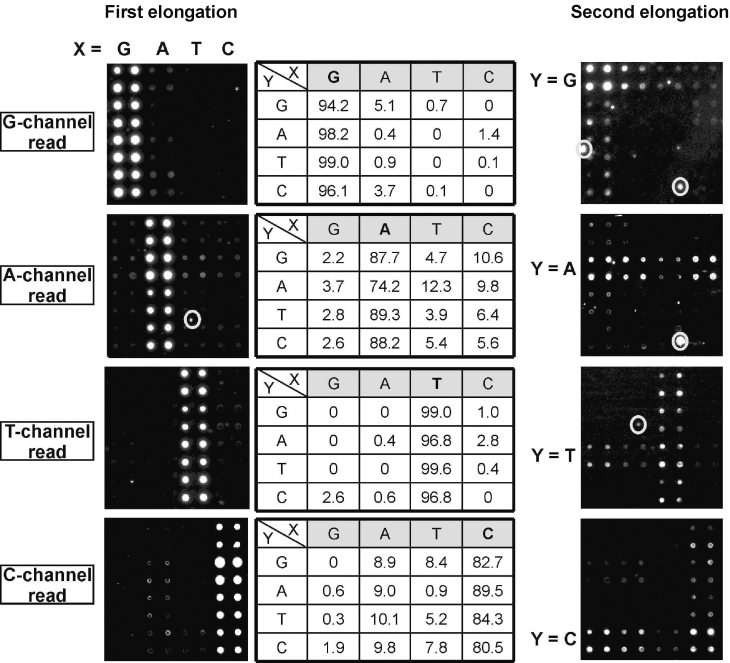
Figure 5.

Imaging for illustration and analysis of the primer-extension events. Signals of the first elongation appear vertically (in column), signals of the second elongation appear horizontally (in rows). Evaluation of the specificity of the primer extension is given in the tables, and the target nucleotide is in bold type. Fluorescence readout channels are shaded and present the data in columns (vertically) for the first extension step. Signals in circles are artefacts.
