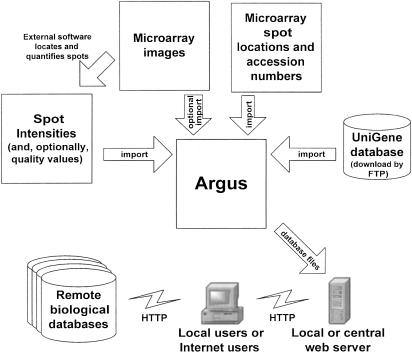
Figure 1.
Data flow diagram. First, microarray spots are quantified using an external program (arrow, top left). Argus then imports all data necessary to analyze a set of microarray experiments (counterclockwise from right): the latest version of the UniGene database, a description of the location of each clone on the arrays, the actual images of the scanned microarrays, and the intensity and quality value of each spot on the arrays. Argus processes these data and produces a database and a set of supporting files that are transferred (arrow, bottom right) to a local or centrally managed Web server. Users (bottom center), whether local or at a remote location, can access all analysis features of the interactive database using a Web browser and also can conveniently access remote biological databases (bottom left) for additional gene information.

