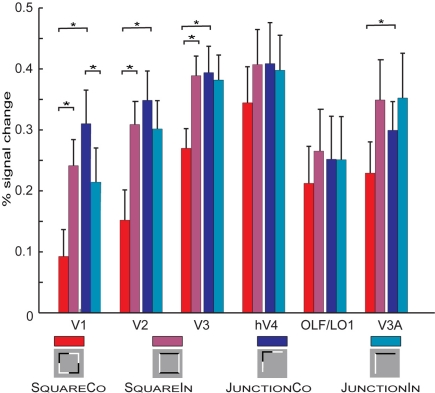
Figure 2.
Summarized responses across all retinotopic ROIs and conditions pooled across hemispheres. Error bars depict SE across subjects. The small pictograms present a simplified version of the actual stimuli (see Figure 1 for a more accurate depiction of the employed stimuli). Important significant differences are marked with stars, for a complete report on significant differences see “Appendix.” For the square configurations the SquareCo condition results in the less BOLD response across all visual areas, this is significant in V1, V2, and V3. For the L-Junction configurations the observed effects are weaker, in the opposite direction and only significant in V1. In V1, V2, and V3 we also find a significant difference between the conditions SquareCo and JunctionCo.

