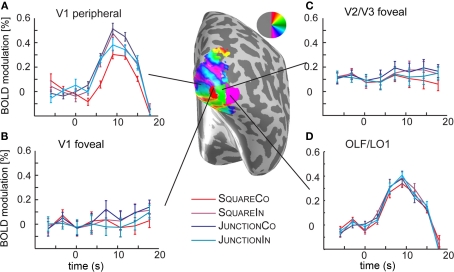
Figure 4.
Analysis of the time courses in the foveal confluence. (A) Shows the time course in the time course in V1 in the periphery, i.e., the region the junction and square stimuli were presented. The curves demonstrate clear response curves to stimulus onset, and different response heights are visible for different shape, and contrast polarity conditions, reflecting the results depicted in Figures 2 and 3. (B) In the foveal regions of V1, however there is no significant response to the stimuli. (C) In foveal V2/V3 the responses are similar to those in foveal V1. (D) Shows the time course in the OLF/LO1 ROI demonstrating a clear response to the stimulus presentation. Note however that the eccentricity maps on this region of cortex (not shown) mostly demonstrate preference for foveal stimuli. Different to the peripheral V1 responses, there is no obvious response modulation with respect to the stimulus conditions.

