Fig. 4.
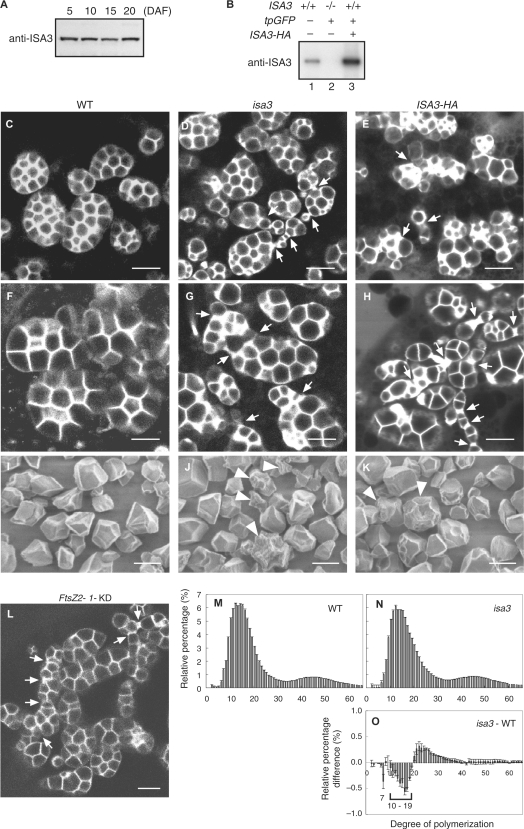
Amyloplast and starch granule morphology in the endosperm cells. (A) ISA3 protein levels in developing seeds. Proteins were extracted from developing seeds at the indicated days after flowering (DAF) and were analyzed by immunoblotting with anti-ISA3 antibody. (B) ISA3 is not detectable in isa3 seed. Proteins were extracted from mature seeds of Nipponbare wild type (lane 1), isa3 transformed with tpGFP (lane 2) and wild-type Nipponbare transformed with tpGFP and ISA3-HA under the control of the AGPS2b promoter (lane 3). (C–H) Amyloplasts in the outer endosperm cells at 8 DAF visualized with stroma-localized GFP. Seed sections of the wild type (C, F), isa3 (D, G) and transformant expressing ISA3-HA (E, H). The starchy endosperm cells shown in C–E and F–H are those in cell layers 1–3 and 4–7 from the outermost aleurone cell layer, respectively. Note that the amyloplasts and granules in the inner cells (F–H) are larger than those of outer cells (C–E). Some amyloplasts in isa3 and ISA3-HA contain starch granules that are heterogeneous in size. Arrows point to constricted or long-necked sites. Bars = 5 μm. (I–K) Scanning electron micrographs of starch granules. Purified starch of WT (I), isa3 (J) and ISA3-HA (K) were directly viewed using an SEM without surface coating. Arrowheads indicate granules that are irregularly shaped and rough on the surface. Bars = 5 μm. (L) Amyloplasts in the outer endosperm cells of FtsZ2-1-KD at 8 DAF visualized with stroma-localized GFP (Yun and Kawagoe 2010). Arrows indicate putative division sites, where constriction of the division septa is not complete. Bar = 5 μm. (M, N) Chain length distribution of wild-type and isa3 amylopectin. Purified starch from wild-type Nipponbare (M) and isa3 (N) seeds was debranched with a bacterial isoamylase, labeled with APTS (8-aminopyrene-1,3,6-trisulfonic acid), and analyzed using capillary electrophoresis. Peak areas were summed, and the areas of individual peaks were expressed as a percentage of the total. The mean ± SE of three independent isoamylase digests is shown. (O) Difference plots derived by subtracting the relative percentage values of the wild type from those of isa3.

