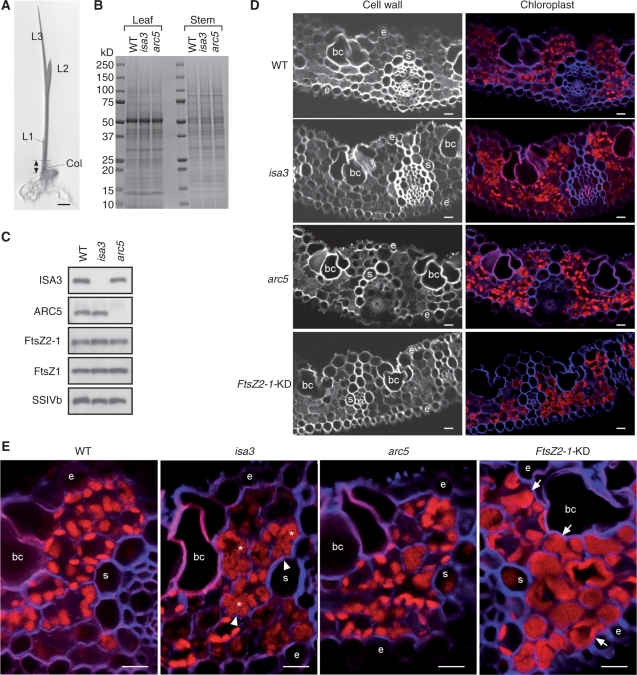
Fig. 7.
Role of ISA3 in chloroplast development in the seedling. (A) Seedling of Nipponbare grown for 2 weeks. L2 and the double-headed arrow show the leaf blade of the second leaf and basal stem region, from which proteins were extracted for SDS–PAGE (B) and immunoblot analyses (C). Col, coleoptile; L1, first leaf; L2, second leaf; L3, third leaf. Bar = 5 mm. (B) SDS–PAGE analysis of proteins extracted from the leaf blade of L2 (Leaf) and the basal stem region (Stem) of the seedling of wild-type (Nipponbare), isa3 and arc5. Total proteins were separated on a 10–20% pre-cast gradient gel (ATTO), and stained with CBB. The amounts of samples were normalized by adjusting the volume of homogenization buffer (15 μl mg FW−1) and 2 μl of supernatant was applied on the gel. (C) Immunoblot analysis of the proteins extracted from the basal stem region of the seedling with antibodies against ISA3, FtsZ2-1, ARC5, FstZ1 and SSIVb. The samples (5 μl of the supernatant) were separated on a 10–20% pre-cast gradient gel. (D, E) Cross-sections of the leaf blade of L2 of 2-week-old seedlings. The sections were stained with 1% (v/v) Calcofluor White in PBS. (D) The left panels show the fluorescence signals of the β-glucans in the cell wall. The fluorescence images of the cell wall were converted to blue and merged with autofluorescence signals (red) including those of Chls (right panels). (E) Merged images of the fluorescence signals of the cell wall (blue) and Chls (red). Asterisks indicate pleomorphic chloroplasts containing deep grooves (indicated by arrowheads). Arrows point to exceptionally large chloroplasts. bc, bulliform cell; s, bundle sheath cell; e, epidermis Bars = 10 μm.

