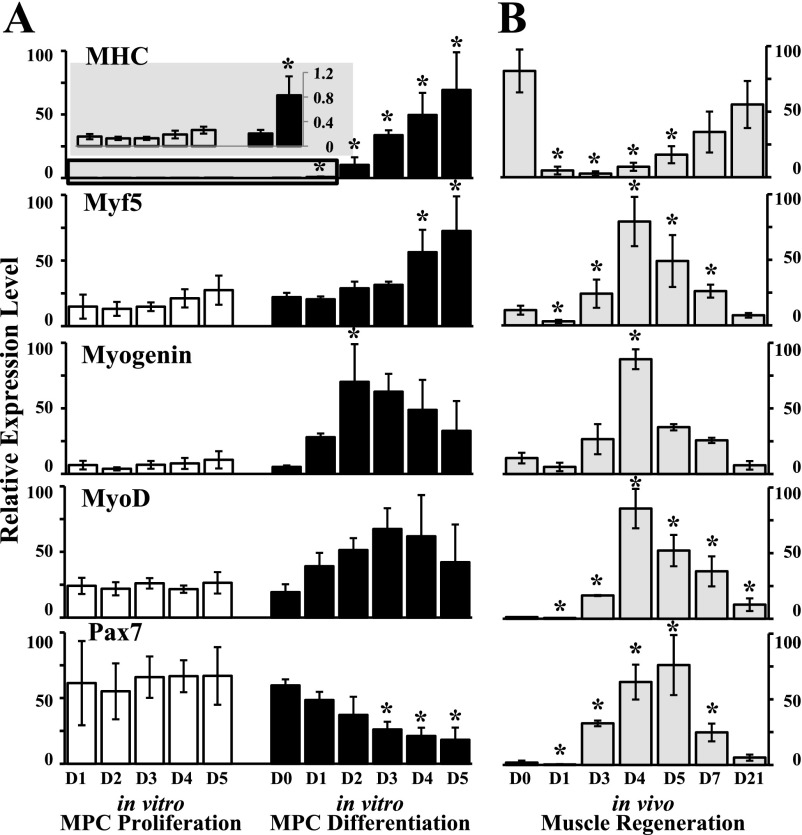
Fig. 2.
Muscle-specific gene expression in cultured MPC compared with in vivo muscle regeneration. Relative levels of mRNA were determined by quantitative real-time PCR in relation to 18S rRNA. A: gene expression in MPC was determined at various time points during proliferation and differentiation. D0, D1, D2, D3, D4, and D5, days 0, 1, 2, 3, 4, and 5, respectively. Myosin heavy chain (MHC) expression during MPC proliferation and at early time points during MPC differentiation is included on an expanded scale (gray-shaded inset). *P ≤ 0.002 compared with day 0. B: in vivo muscle regeneration at baseline (day 0) and at various days (day 1 through day 21) after cardiotoxin injection (D1–D21, respectively); *P ≤ 0.008 compared with day 0. Data represent means ± SD of 4 different MPC primary cultures or 4 mice per time point in vivo.

