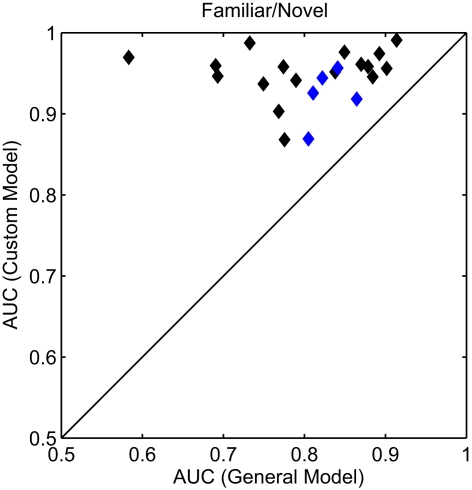
Figure 6.
Receiver operating characteristics analysis of classifier models. Scatter plot of the AUC for each participant. All AUC values were calculated for the familiar (personal and famous) versus novel condition. The x and y axes represent the two model conditions: a general model (same for all participants) and a custom model (unique to each participant). Blue diamonds indicate the individual participants whose custom model was validated with a second, independent experimental session.

