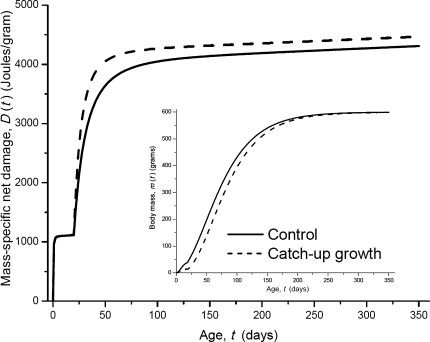
Figure 3.
The difference in mass-specific net damage, D(t), due to catch-up growth. The inset shows the growth curves of two animals of the same species. Both animals have the same adult mass (600 g). The birth mass of the catch-up growth animal (dashed line) is 15 g, and the one of the control animal (solid line) is 45 g. The curves are computed from equation (4); the values of other parameters are listed in Table 1. Note: The catch-up growth animal (Animal 1) has slower prenatal growth than the control animal (Animal 2), so the total net damage is smaller in Animal 1. In equation (6), we compare the mass-specific damage in adulthood, and the mass in the denominator is adult mass, M, which is the same for both individuals. So, the second and third terms in equation (6) of Animal 1, which represent the damages associated with prenatal growth, are smaller than those of Animal 2. However in this figure, D(t) during prenatal growth is calculated as the total net damage divided by the prenatal masses at time t, so the smaller total damage in Animal 1 is cancelled out by the smaller body mass of Animal 1. Therefore, the rate of mass-specific damage, D(t), during prenatal growth is almost the same in Animals 1 and 2 as shown in this figure.

