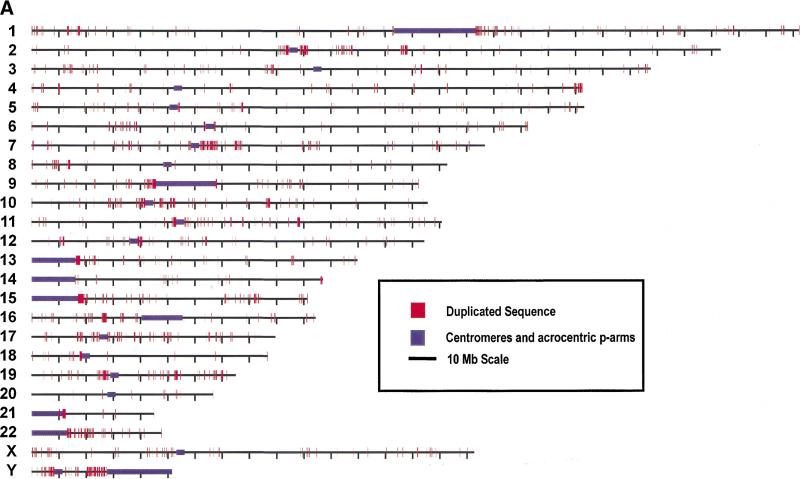
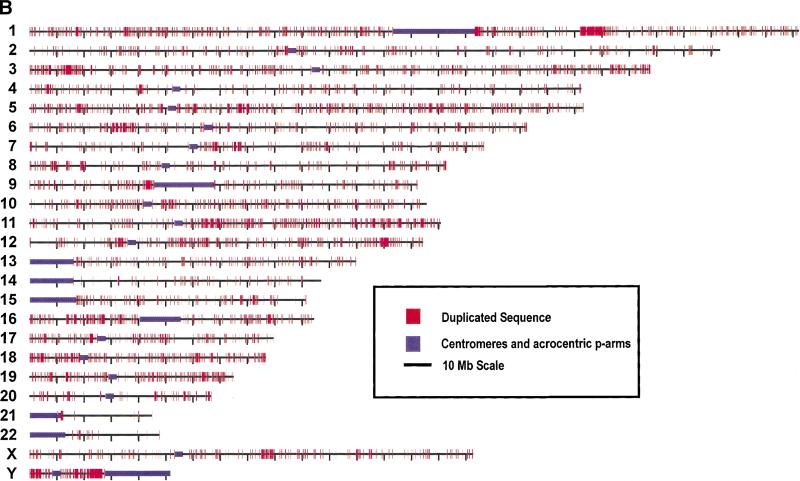
Figure 3.
Genome-wide view of segmental duplications. The positions of alignments are depicted in red for each of the 24 chromosomes. Panels separate alignments on the basis of similarity: (A) 90%–98% identity and (B) 98%–100% identity. Purple bars depict centromeric gaps as well as the p-arms of acrocentric chromosomes (13, 14, 15, 21, and 22).Because of scale constraints, only alignments >5 kb are visible. Views were generated with the program PARASIGHT (J.A. Bailey, unpubl.), a graphical pairwise alignment viewer.


