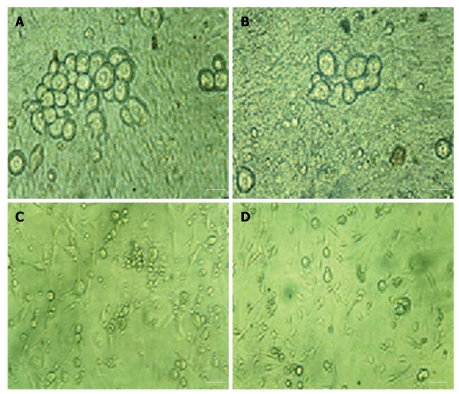
Figure 5.
Morphological changes in dorsal root ganglion neurons. A: Monoculture of dorsal root ganglion (DRG) neurons on the 1st d (× 400); B: Monoculture of DRG neurons on the 7th d (× 400); C: Co-culture of DRG neurons and infected BxPC-3 cells (× 200); D: Co-culture of DRG neurons and normal BxPC-3 cells (× 200). Scale bars: 25 μm (A, B) and 50 μm (C, D).

